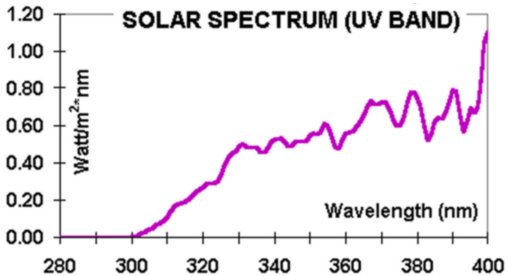
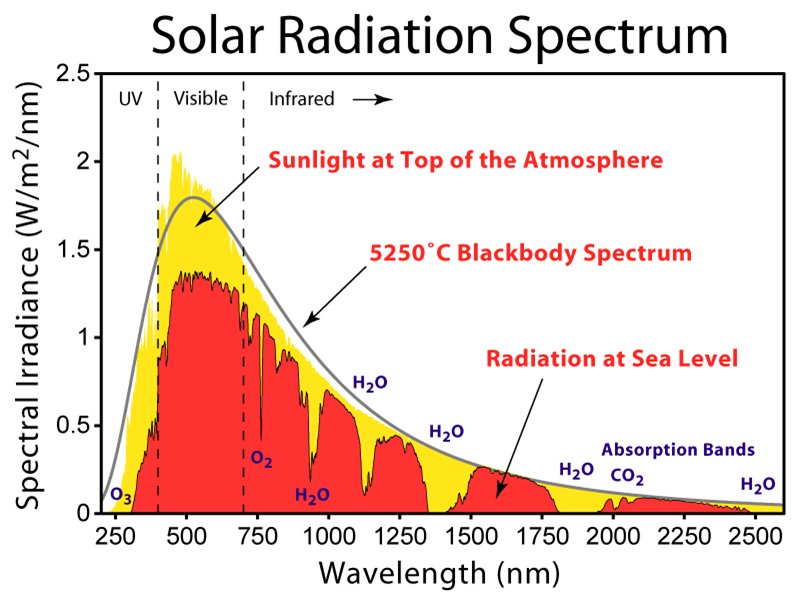
 Hover over the images and read nm/power output in the status bar
(make sure that the screen is maximized - does not work with horizontal scrollbar)
LEFT: Solar UV spectrum measured in Florence
(Italy) during a clear day (22 July 1997)
at solar noon
(click here for ref)
RIGHT: The graph on the right is from GlobalWarmingArt


